Tracing Framework
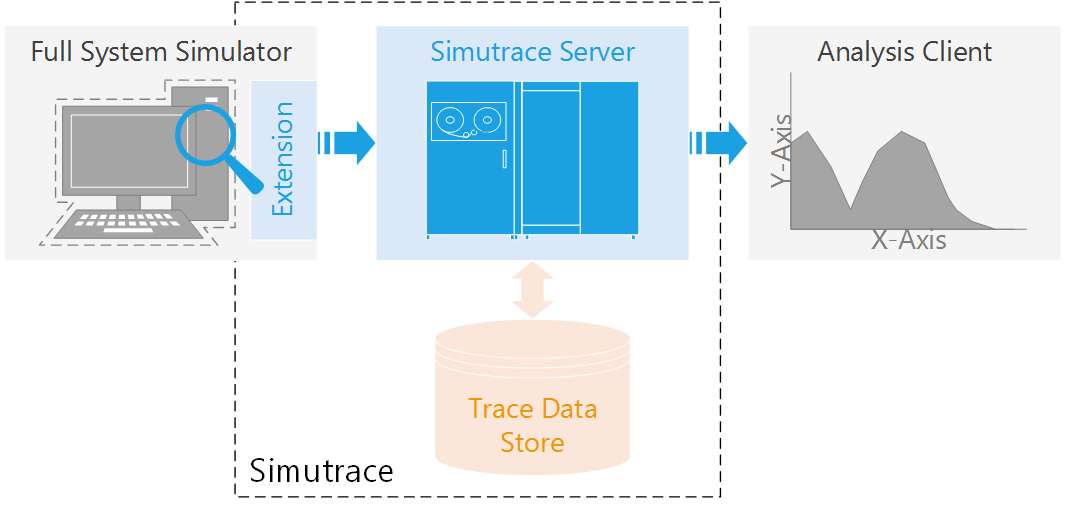
 The tracing components build the core of the Simutrace project and have been conceived with full length, no-loss tracing in mind. Simutrace uses a client-server architecture, where an extension in a full system simulator collects events (e.g., memory accesses) and a storage server receives the data, performs trace compression and storage as well as provides easy access to the data for later analysis and inspection. Simutrace places no restriction on the type and number of captured events and employs a scalable storage format, which easily handles traces of terabytes in size.
Simutrace has been particularly extended to facilitate efficient memory tracing by capturing memory accesses in the simulation, thus including all user-space programs, the operating system, drivers and direct memory access (DMA) operations. Besides recording data addresses, Simutrace also captures the transferred data. That allows reconstructing the full memory contents of the simulated machine at any point. In addition, the integrated memory entry format includes the instruction pointer (IP) of the operation that issued the memory access, thus retaining most control flow information. However, Simutrace can also be used to create full instruction traces or record supplementary information such as events generated by an introspection layer.
In this video, we connected a simple demo client to Simutrace, which reconstructs the physical memory contents of an Ubuntu machine, booting and building the Linux kernel. The trace encompasses all CPU read and write operations, introspection information on process events (fork, exec, switch, kill) and screen buffer output. The 3.6 TiB of raw data were compressed by Simutrace down to around 110 GiB. The demo shows all activity on the physical memory pages. Read accesses to a page frame are displayed in green and write accesses in red. Page frames experiencing both, reads and writes, are marked yellow.
The key features of Simutrace are:
- Holistic and non-intrusive system tracing through full system simulation.
- Flexible and modular, client-server-based architecture.
Per connection shared-memory (local) or socket-based (remote) communication. - Support for multiple concurrent sessions.
Trace multiple simulations concurrently or read/inspect recorded data while still tracing. - Stream-oriented event recording model.
No restriction on type of data captured (variable-sized data supported). - Multi-threaded tracing to support recent parallel multi-core simulators.
- Fully asynchronous and multi-threaded trace processing engine.
- Integrated memory trace compressor.
VPC4 prediction-based memory trace compression with LZMA.
Aggressive but fast compression of address traces including access data and control flow information. - Scalable storage format supporting partial decompression.
Allows recording long-running workloads with raw traces of terabytes in size. - In-memory index for fast seeking to specified time spans.
Simutrace is available for download here.
Contact: Dr.-Ing. Marc Rittinghaus
| Author | Title | Source |
|---|---|---|
Marc Rittinghaus, Thorsten Groeninger, Frank Bellosa |
Simutrace: A Toolkit for Full System Memory Tracing | White Paper, Operating Systems Group, Karlsruhe Institute of Technology, 2015 |
| Speaker | Title | Conference |
|---|---|---|
Thorsten Groeninger, Marc Rittinghaus |
Efficient Full System Memory Tracing with Simutrace | GI-BS Fachgruppentreffen, TU Dresden, Mai 2014 |
| Author | Title | Type | Advisor |
|---|---|---|---|
| Jonas Julino | Lightweight Introspection for Full System Simulations | Diplomarbeit | Prof. Dr. Frank Bellosa, Marc Rittinghaus |
| Julian Faude | On the Applicability of More Accurate Page Access Information | Masterarbeit | Prof. Dr. Frank Bellosa, Marc Rittinghaus |
| Jan Ruh | Analyzing Duplication in Incremental High Frequency Checkpoints | Bachelorarbeit | Prof. Dr. Frank Bellosa, Marc Rittinghaus |
| Felix Wilhelm | Tracing Privileged Memory Accesses to Discover Software Vulnerabilities | Masterarbeit | Prof. Dr. Frank Bellosa, Marc Rittinghaus |
| Thomas Schmidt | Evaluating Techniques for Full System Memory Tracing | Bachelorarbeit | Prof. Dr. Frank Bellosa |
