Mandatory
For thesis structure, you must obey the rules in Kevin Elphinstone's A Small Guide to Writing Your Thesis. Also read and be prepared to follow the general principles of Gernot Heiser's A Style Guide for Students Writing Papers and Reports.
For English usage, especially concerning the most common constructs, read and consult The Elements of Style by William Strunk Jr. and E.B. White. The book is short and quickly read. Also consider reading the much longer book BUGS in Writing by Lyn Dupre, especially if you plan to write several English theses.
Process
Please prepare to iterate through several versions of your paper. It is a process of convergence. Prepare an outline at the start of your thesis period. After some exposure to your topic, start writing the thesis. As often suggested by Professor Goos, provide artificial data and results as place holders for the real data, to help you see whether your intended results will support your arguments, and whether you need to plan for different experiments.
Your primary goal of the thesis is to prove that you can (1) aggregate many details and data and related work, (2) abstract and conceptualize the content, and (3) then present concise concepts to the reader. Your thesis at the end must be easy to read, and accurately present your information. To reach this point, you'll rewrite parts of the paper several times. As an example, we restructured our final OSDI '04 paper six or seven times (it started as a concept paper, then was rewritten for OSDI, and then went through a shepherding stage; each step involved two or three major modifications).
Common Faults
Write your thesis in an authoritative style. You must convey the idea that you know the material, that you accept responsibility for your thesis, and that the reader should believe you. From The Elements of Style:
If your every sentence admits a doubt, your writing will lack authority. Save the auxiliaries would, should, could, may, might, and can for situations involving real uncertainty.
Provide citations for all data, concepts, and claims that are not directly proven by your research, unless it is common text book knowledge. For example, you must provide a citation when introducing the term paravirtualization. Your thesis will not be accepted unless it has proper citations.
Help with LaTeX
Starting
If you need a starting point for LaTeX, find a gzipped archive of a template here.
Consider reading The Not So Short Introduction to LaTeX 2e . Various forms of LaTeX documentation are installed with LaTeX. For example, you can find a short manual which describes the options for the graphicx package at /usr/local/share/texmf/doc/latex/graphics/grfguide.ps.
Backups
Please store your LaTeX source in a CVS repository (or equivalent document version control system) on i30pc5. i30pc5 is backed-up. By using CVS, you can synchronize your writing across your laptop, home computer, and work computer. The CVS version numbers provide a reference point for the reviewers. The LaTeX template defines a footer that prints the version number, date, and page number on each page. Please use this footer.
Graphics
We use gnuplot, MetaPost, OmniGraffle, and Microsoft Office for generating charts, graphs, and diagrams. MetaPost output integrates natively with LaTeX. Gnuplot output can also integrate natively with LaTeX. For others, we use encapsulated postscript (eps). Feel free to use other utilities for generating graphics and plots.
Dimensions
Size your graphics to match the dimensions of your LaTeX document. The example LaTeX document above outputs useful dimensions to its log file and to the screen, when building. Consider sizing your graphics to the width of the text column, which is either \columnwidth or \textwidth. The dimensions are in LaTeX points, where 1pt is 1/72.27 inch. For the example above, its textwidth is 345.0pt, and thus 4.77 inches. The output from the above example:
====> Dimensions: dimension: columnwidth 345.0pt dimension: textwidth 345.0pt dimension: textheight 598.0pt dimension: paperwidth 597.50787pt dimension: paperheight 845.04684pt dimension: hoffset 0.0pt dimension: voffset 0.0pt dimension: topmargin 23.0pt dimension: headheight 12.0pt dimension: headsep 18.06749pt
Font sizes in encapsulated postscript will be incorrect if you scale the picture size after drawing the picture. Thus set the size of your drawing canvas to the desired output size of your picture.
Note: one way to determine LaTeX dimensions is to typeset them into a LaTeX document. To print a dimension in a LaTeX document, use \the as in "The column width is \the\columnwidth."
gnuplot
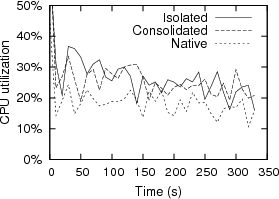
For encapsulated postscript, gnuplot plots to a 5 inch by 3.5 inch canvas. You will undoubtedly desire a different plot size, but this requires scaling the picture post-rendered and results in incorrect font sizes. The solution is the epslatex gnuplot terminal, which produces a combination of encapsulated postscript and LaTeX to represent the graphics and text. It generates a LaTeX script to overlay the text on the eps picture. The result is that your figure uses your LaTeX font, and thus integrates well with the remainder of your document.
The epslatex terminal generates two files, a LaTeX plot and an eps file, with file names derived from set output. The LaTeX plot handles the eps file; you only need to import the LaTeX plot into your LaTeX document using the \input{} command. Be sure to first include the graphicx package in your LaTeX document.
The default epslatex canvas size is 5 inches by 3 inches (note that the height differs from the default eps canvas size). Adjust the canvas size using the set size command. The set size command accepts parameters to scale the picture relative to the default size. For example, if your LaTeX textwidth is 345.0pt, and you want the figure to be the full width with a 2 inch height, then use
set size (345.0/72.27)/5.0, 2/3.0
An example document contrasting the epslatex terminal output to encapsulated postscript output: PDF, and the source.
Here is an example:

#!/usr/bin/env gnuplot
##  Configure for a 10pt font size
set terminal epslatex color dashed "default" 10
##  Choose the output file name; we generate two files based on this name.
set output "cpu.eps"
##  Configure for 221.0pt width and height
set size (221.0/72.27)/5.0, (221.0/72.27)/3.0
set xlabel "Time (s)"
set ylabel "CPU utilization"
set format y "%g%%"
plot [0:] [0:50] \
"data/postmark-nfs-cpu.dat" using 5:6 title "Isolated" with lines, \
"data/postmark-nfs-cpu.dat" using 3:4 title "Consolidated" with lines, \
"data/postmark-nfs-cpu.dat" using 1:2 title "Native" with lines
Microsoft Office
Remember to use standard PDF and PostScript fonts, such as Times and Helvitica, to match the fonts of your LaTeX document. Avoid Microsoft's fonts, such as Arial.
Microsoft Office applications are unable to generate encapsulated PostScript. An intermediate step is necessary. If you use Windows, print your graphic to the Adobe encapsulated-PostScript printer driver. If using the Macintosh, then transfer the Microsoft Office object, via the clipboard, into OmniGraffle and then export as encapsulated PostScript (we've tested this with OmniGraffle v. 3.1.2). OmniGraffle won't let you edit the object, but it will treat it as a vector drawing, and thus generate nice encapsulated PostScript. If you don't have access to a tool that can convert the Microsoft object into encapsulated PostScript, then you can try your luck with using Microsoft's PostScript support. Print to a PostScript file, and then convert to encapsulated PostScript using ps2eps. The output will often be broken; sometimes you may need to override the bounding box, which you can determine with a PostScript viewer such as gv, and then specify the bounding box in the LaTeX file.
- PowerPoint
-
Consider configuring for portrait mode, rather than the standard landscape. Alternatively you can rotate the figure during later processing steps (such as when importing into LaTeX, using the
angle=90parameter). Also set the page size to the dimensions of your LaTeX column, so that you can visualize the size of your drawing area. Use the font size that matches your LaTeX document; you don't have to scale the PowerPoint output if done properly. - Excel
-
Graphs and plots are highly configurable. Please take the time to format the plots to match the look-n-feel of LaTeX. I advise disabling the solid background color of all chart elements; make them transparent so that LaTeX can control the background color (and stack pictures if necessary). Disable the border around the chart. Disable the legend if it is superfluous; consider writing text directly on the chart area rather than using the key. Don't rely on colors; use dashed lines, etc.
It is possible to create a chart that matches the size of your LaTeX column, and thus you can avoid scaling the output. After you create your chart, open the dialog box for formatting the chart area, disable font auto scaling, and then set the font to the correct size and type. Next, set the size of the chart to the size of your LaTeX column.
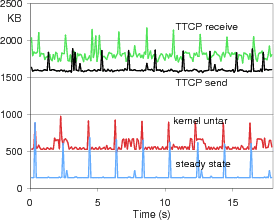
Here is an example of Excel output. Note that the text was written next to the plots for clarity; it is difficult to configure Excel for line styles which print reasonably.
-

Encapsulated Postscript (eps) in LaTeX
Import the eps file into your LaTeX document using the LaTeX includegraphics command of the graphicx module. The following is an example which first rotates a landscape eps file, and then sizes it to match the column width:
\begin{figure}[tb]
\centering
\includegraphics[angle=90,width=\columnwidth]{arch.eps}
\caption{The architecture.}
\label{fig:architecture}
\end{figure}
Here is an example which manually specifes the bounding box, and scales the size to 90% of the column width:
begin{figure}[tb]
\centering
\includegraphics[width=.9\columnwidth,bb=67 385 525 742]{cpu.eps}
\caption{CPU utilization.}
\label{fig:cpu_utilization}
\end{figure}
If your encapsulated-PostScript file is already correctly scaled, then don't adjust its width on import.
If you have output from gnuplot with the epslatex terminal, then import the LaTeX file generated by gnuplot:
\begin{figure}[tb]
\centering
\input{epslatex/working_set}
\caption{Working set footprint.}
\label{fig:working_set}
\end{figure}
Be sure to use the graphicx LaTeX package to be compatible with the gnuplot LaTeX output.

